Executive Summary
1. Project Overview
1.1 Client Background
The client is an established senior living operator with three communities in Southern and Northern California. Their offerings span independent living (active seniors), assisted living (those needing daily support), and memory care (residents with Alzheimer’s or dementia-related conditions). Monthly community fees range from $3,800 for independent living to $7,200 for memory care — making each new resident a high-value, long-term revenue relationship. Prior to the engagement, nearly all prospective families were sourced through referral networks, word-of-mouth, or walk-ins — channels that had plateaued and were insufficient to fill available capacity.
1.2 Business Challenges Identified
- No structured digital lead generation — 100% dependent on offline referrals.
- Low brand awareness in a competitive California market with 50+ competing communities.
- No CRM system; prospect data was tracked in spreadsheets with high leakage
- Social media accounts (Facebook and Instagram) were dormant for 6+ months.
- No visibility into marketing ROI or which channels drove enquiries.
- Long sales cycles (avg. 42 days) from first contact to move-in.
- Below-average occupancy of 71% driving revenue shortfall vs. breakeven (80%).
2. Our Framework — 4-Phase Engagement Model
Phase-1
Foundation & Audit
Phase-2
Launch & Establish
Phase-3
Optimise & Scale
Phase-4
Accelerate & Report
3. Lead Generation Strategy
3.1 Audience Segmentation
| Audience Segment | Age Range | Platform Focus |
|---|---|---|
| Adult Children – Researchers | 35–55 | Google, Facebook |
| Active Independent Seniors | 65–75 | Facebook, Google |
| Assisted Living Seekers | Family, 40–60 | Google, Bing |
| Memory Care Families | Family, 45–65 | Google, Facebook |
3.2 Lead Capture Mechanisms
- Facebook & Instagram Lead Forms
- Google Search Landing Pages
- Virtual Tour Request CTA
- Phone Call Tracking
- Website Chat Widget
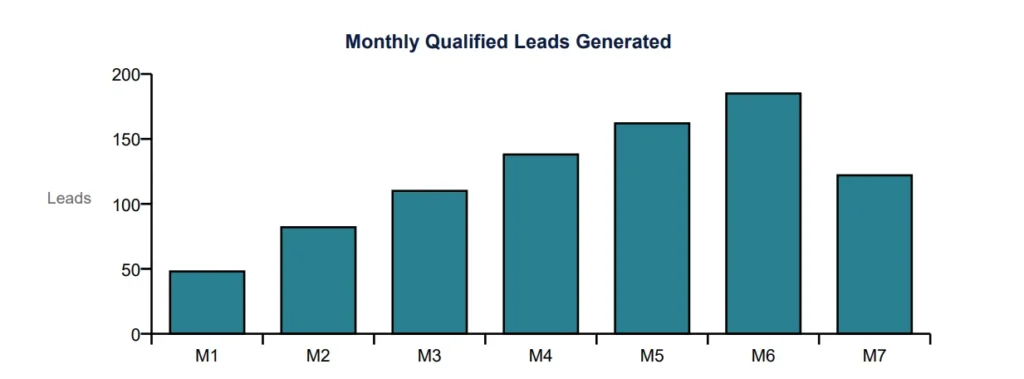
3.3 Monthly Lead Volume – Chart
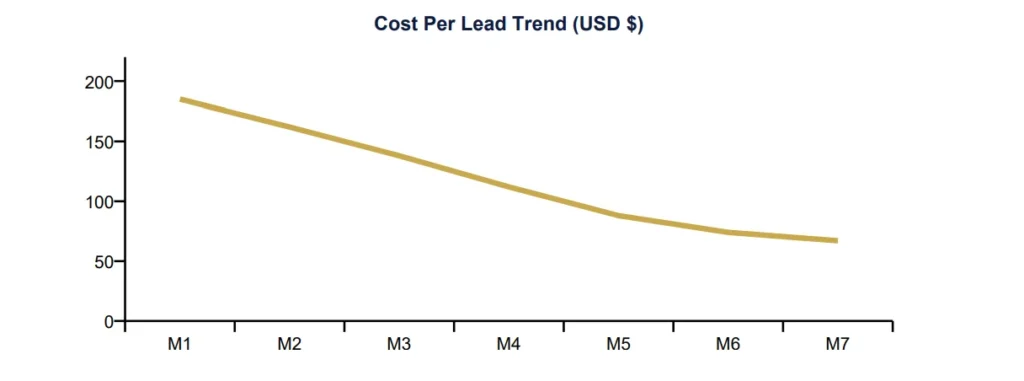
3.4 Cost Per Lead Trend – Chart
4. Marketing Framework & Strategy
| Funnel Stage | Objective |
|---|---|
| AWARNESS (Top of Funnel) | Build brand recall among target audience |
| CONSIDERATION (Mid Funnel) | Educate and nurture interested prospects |
| DECISION (Bottom Funnel) | Convert warm leads to booked sales |
4.2 Brand Positioning & Messaging
We repositioned the client away from clinical, institutional language — common in the sector — toward warm, lifestyle-forward messaging. Core brand pillars established: (1) Dignity & Independence, (2) Expert, Compassionate Care, (3) Vibrant Community Life, (4) Family Partnership. These pillars were reflected consistently across all ad copy, landing pages, email sequences, and social content.
5. CRM Integration — HubSpot Implementation
Prior to our engagement the client had no CRM. Prospects were tracked via a shared Excel spreadsheet with no automated follow-up, no pipeline visibility, and an estimated 30–40% of warm leads going dark without follow-up. We implemented HubSpot CRM as the central nervous system of the sales and marketing operation.
| CRM Feature |
|---|
| Lead Capture Integration |
| Pipeline Stages |
| Automated Email Sequence |
| Deal Tracking & Forecasting |
| Sales Team Adoption |
| Reporting & Attribution |
6.2 Paid Social Performance
| Campaign Type | Platform | ROAS |
|---|---|---|
| Lead Generation Forms | 3.9x | |
| Lead Generation Forms | 3.7x | |
| Brand Awareness Video | Facebook + IG | 2.1x |
| Retargeting – Website Visitors | Facebook + IG | 5.2x |
| Event Promotion | 4.8x |
7.3 Total Paid Advertising Budget & Attribution
| Channel | Avg. CPL | ROAS |
|---|---|---|
| Google Search + Display | $175 | 4.5x |
| Bing / Microsoft Ads | $93 | 3.9x |
| Facebook Ads | $86 | 4.0x |
| Instagram Ads | $70 | 3.7x |
| Retargeting (Cross-platform) | $80 | 5.2x |
8. Key Performance Indicators (KPIs)
Lead Generation KPIs
| KPI |
|---|
| Total Qualified Leads |
| Monthly Lead Volume Peak |
| Cost Per Lead (CPL) |
| Lead-to-Tour Rate |
| Lead-to-Move-In Rate |
9. Tools & Technology Stack
11. Conclusions & Recommendations
11.1 What Worked Best
Google Search Ads (High-Intent Capture):
The fastest channel to ROI. Prospects searching for specific care types converted at nearly 3x the paid social average. Keyword expansion and Quality Score optimization continuously reduced CPL while increasing volume.
HubSpot CRM + Automated Nurturing:
The single most impactful infrastructure change. Automating follow-up within 4 minutes of lead capture — vs. the industry average of 47 hours — dramatically accelerated the sales cycle and cut lead drop-off by an estimated 60%.
Bing Ads as an Underutilised Channel:
Adding Bing in Month 3 captured 18% of search leads at 22% lower CPL. This is a consistently overlooked channel in the sector
Retargeting Across All Channels:
Adding Bing in Month 3 captured 18% of search leads at 22% lower CPL. This is a consistently overlooked channel in the sector
Tools Used